Viewing Alarms and Events
To view alarms or events, click Alarms/Events, then click Alarm Log or Event Log.
The Event Log displays all alarms and events that have occurred. The Alarms Log displays enabled alarms.
NOTE: If the alarms are not displaying correctly, see When alarms do not display correctly.
See The Alarm Log, below, for descriptions of color codes.
Equipment column
On the left side of the page, there is an equipment column. To hide or display this column, click the splitter:
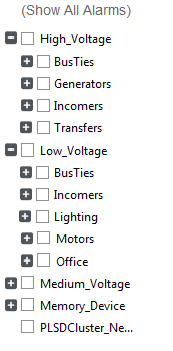
All of the equipment in the project is listed. Most of the equipment is grouped by voltage level. By default, none of the names are checked, which means that information for all of them will display. To list alarms and events for a shortened list of equipment, check the box(es) to the left of the equipment name(s).
The number to the right of the equipment name is the number of active alarms for that equipment.
Filter information
To filter the information that displays, click Filter (just above the Date column). From the Alarm Filter window, you can select from a variety of filters. See Alarm/Event filter form for more information.
Remove, insert, and move columns
To remove a column from the list:
Right-click its header and then click Remove Column.
To insert a column:
Right-click a column header, click Insert Column, and then from the dropdown list click the name of the column you want to insert.
The new column displays to the left of the column you right-clicked. If you right-click the white area to the right of existing columns, you will insert the column to the right of the last column.
To move a column:
Click the column that you want to move and then drag the column to the new position.
Sort by column
To sort on the information in a single column (such as the Equipment column), double-click the column header. It will toggle between ascending and descending order.
Event log
The Event Log lists alarm/event activity, most recent first (provides sequence of events information). The time is reported to the millisecond. You can display the Message column to see the most detail (such as, "Alarms disabled" and "Alarm xxx acknowledged").
Alarm log
To filter the alarms that display, click Filter (just above the Date column.) You can filter by date range, by text matches for various attributes, or by alarm type. See instructions on using the filter option in Alarm/Event filter form.
- Acknowledged active alarms display in a normal red font.
- Unacknowledged active alarms display in a bold red font.
- Acknowledged inactive alarms display in a normal gray font.
- Unacknowledged inactive alarms display in a bold gray font.
Each alarm provides additional options. To view these options, right-click the alarm. Then you can do the following. Note that these changes will remain only until you leave the page. To set the order, use the parameters,
- Acknowledge or disable the alarm.
- View alarm detail (similar to the genie status page in the one-lines of the runtime environment).
- View waveforms: (If the [equipment name Waveform] option does not display, there are no waveforms for this alarm.) Waveforms can display only if the device is set to “acquire on event,” and the waveform option is checked in the Profile Editor
- The alarm has been acquired at the device, but it has not yet been passed to Power Operation
- The device was not set to acquire a waveform, and the waveform option was checked in the Profile Editor.
When the waveform is available for viewing, the Search Waveform dialog displays. From this dialog, click Time Range, and then select the appropriate times; or click All Available to see all waveforms for this equipment. Click OK to display a list of waveforms that fit the date criteria. Highlight the waveform and click View.
After the selected waveform displays, you can view a PDF file that describes the operation of the waveform viewer. Access this file (WaveWeb.pdf in the Citect Bin folder (64-bit example: C:\Program Files (x86)\Schneider Electric\Power Operation\v2024\bin).
Waveforms must be correctly set up before they will display.
When you select the waveform option, you may see a message telling you “please try again after waveform has been acquired.” This means one of two things:
NOTE: If there are multiple waveforms captures for this alarm, and if there is a disturbance waveform, it is the only one that is available here. If there are both an adaptive and transient, but no disturbance, the one with the earliest time stamp displays.
Unacknowledged alarms and disabled alarms
As with the Alarm Log, these logs display either unacknowledged alarms or disabled alarms. The sort and filter options operate as they do in the Alarm Log.
Alarm and events logging
Alarms from the Event Log can be saved to a file on the Alarm Server, thus protecting them from being lost when the FIFO size is passed. This feature is disabled by default, but it can be enabled by setting the FileFormat INI parameter.
[PLSEventLog] FileFormat: Determines the file format to be used for logging alarm/event data to disk files.
Allowable Values:
- 0 - (Disable)
- 1 - (CSV)
- 2 – (XML)
- Default value: 0
Acknowledge, silence, and print
Each of the logs includes these buttons:
See also: Equipment Pop-Up Page